DEI Metrics: A Comprehensive Guide to Measuring Diversity, Equity & Inclusion

Stress at the workplace has reached an all-time high, with many workers not getting adequate breaks. A 2023 study by the American Psychological Association found that only 35% of workers say their company promotes break-taking. At the same time, 92% of employees think it matters to work in a company that is concerned with emotional and psychological well-being, and 57% treat it as the top priority.
However, most organizations fall short of this expectation. Biases in the workplace, non-inclusiveness, and system disparities still cause harm to employees' well-being, retention, and productivity. Companies often struggle to identify gaps without clear benchmarks.
DEI metrics can help address systemic barriers, improve policies, and foster a more inclusive culture. In this article, we'll track and analyze DEI metrics to promote a fair, diverse, and equitable workplace.
What are DEI metrics?
DEI metrics track the effectiveness of diversity, equity, and inclusion efforts in your organization. They combine DEI data, like hiring rates, promotion patterns, and employee sentiment. These metrics give you a clear picture of how well your DEI initiatives are working.
You can use these metrics to identify areas that need attention, measure progress, and see where you're succeeding. They help you look for any barriers employees may face in recruitment, career growth, or day-to-day experiences.
Companies with strong diversity initiatives see higher innovation, lower turnover, and better financial performance.
Why are DEI metrics important?
Companies do not build inclusive workplaces by making broad statements. They need measurable proof that their efforts lead to actual change.
Here’s why you should track DEI metrics:
- Recruits the best talent: A diverse workforce attracts quality talent and increases employee retention. This is because a positive environment creates longer job satisfaction
- Increases employee satisfaction: When employees notice actual attempts to foster a welcoming environment, they feel respected and motivated, which translates to greater job satisfaction and company loyalty
- Reduces microaggressions in the workplace: Microaggressions, small but harmful comments, are less likely to thrive in inclusive workplaces. Employees feel empowered to speak up, educating colleagues on why these behaviors must change
- Identifies gaps and inequities: Equity metrics uncover where your organization may still have blind spots. For instance, you may not realize that certain groups are underrepresented in leadership positions, face a pay gap, or deal with bias in hiring processes. By identifying these areas, HR can gain leadership support to take concrete actions to address systemic issues.
- Improves business outcomes: Organizations that perform well in corporate diversity report better financial results, higher innovation rates, and increased employee satisfaction. In fact, a study found that these organizations were 2.1 times more likely to beat competitors to market, highlighting the powerful impact of a solid DEI strategy.
Top 15+ key DEI metrics to track
Now that you better understand what a diverse and inclusive workforce includes, here are 15+ metrics to assess how your organization compares.
1. Demographics across organization levels
Organizations often show diversity at the entry level but lack it in leadership roles. You must break down your employee data at every level, from entry-level workers to executives. Otherwise, you miss key insights into where diversity might be lacking, especially at the top.
To find these demographics, divide the number of individuals in a specific demographic category by the population at this level. Suppose your organization has 100 senior managers, and five of them belong to underrepresented groups. Your calculation would be: 5/100 = 0.05 or 5%. This is your starting point.
For instance, Salesforce monitors its diversity at all levels of the company. In 2024, women comprised 36.1% of their worldwide employees, while men comprised 63.6%. This is a breakdown of all the details:

This data helps Salesforce monitor their DEI KPIs and focus on improving workplace inclusion at senior levels.
Tracking these demographics helps companies set measurable goals for organizational development and board diversity initiatives. It allows for targeted actions to drive diversity at all levels and helps you see how well your organization performs in these areas.
2. Retention and turnover rates
How long employees remain with your organization can provide clear insights about how effectively your inclusion strategy is succeeding. As you study your retention rates, it can help you understand which groups of employees might feel disconnected or ignored. If certain groups are not sticking around, there may be a problem in the workplace culture or your DEI efforts.
Here's how you can measure retention:
Retention rate = (Total employees - Employees who left) / Total employees x 100
Say you have 100 female employees and 10 left during the year. Your calculation would be:
Retention rate of women = (100 - 10) / 100 x 100 = 90%
You can dig deeper by segmenting your groups further, perhaps by age or tenure. You can look at how Gen Z, Millennials, and Baby Boomers fare in retention to shed light on generational differences in employee engagement.
Next, combine retention rate data with exit survey insights to determine why some groups remain or depart. Perhaps it's the absence of leadership diversity, or perhaps the talent diversity pipeline isn't as welcoming as it can be. This knowledge allows you to modify your practices and create a more nurturing environment.
Conversely, the rate of turnover is a little more nuanced. It indicates how many individuals are exiting your organization, and you can determine it based on this formula:
Turnover rate = Employees who left/ Total employees x 100
For instance, if your Baby Boomer workforce consists of 200 employees and 30 resigned, you obtain:
Turnover rate for Baby Boomers = 30/ 200 = 15%
If your turnover rate is higher in a specific demographic group, it might highlight an adverse impact in your workplace. For instance, a survey from Ensono revealed that a fifth of women in tech across the U.S., U.K., and India planned to leave their roles within a year. Higher turnover among certain groups often signals deeper DEI issues that need addressing.
Tracking promotion rates and employee advancement also helps you identify gaps in career progression across different demographics. Pay attention to who is getting promoted and whether an imbalance could indicate an issue with inclusivity in leadership or opportunities for growth.
When you monitor retention and turnover, you create accountability. You also strengthen diversity reporting, which creates a more inclusive workplace.
3. Adverse impact analysis
Adverse impact is when a particular group is harmed by a firm's hiring, promotion, or other employment practices, even if those practices are not discriminatory. When you find this measure, it allows you to quantify the fairness of your diversity recruitment efforts. It also ensures that your workplace policies do not unintentionally affect certain groups.
In order to calculate the adverse impact, you’ll need to use a formula called the 4/5ths rule (also known as the 80% rule). This rule compares the selection rates of different groups and identifies if one group is being selected at a significantly lower rate than others.
The calculation looks like this:
Adverse Impact Ratio = Selection rate of the protected group/ Selection rate of the most favored group
For example, if 60% of male applicants are hired, but only 30% of female applicants are hired, the calculation would be:
Adverse Impact Ratio = 30%/ 60% = 0.5
If the ratio is below 0.8 (or 80%), this indicates adverse impact, suggesting that the hiring process may unintentionally discriminate against women in this case.
For example, if certain groups consistently face barriers, it may point to systemic inequalities that need fixing. This could involve adjusting your inclusion strategy, revamping recruitment practices, or offering more support to underrepresented groups.
If your company can identify and eliminate adverse impact, you can improve both employee advancement opportunities and leadership diversity, making your organization stronger and more equitable for all.
4. Promotion and advancement rates
If an organization is serious about DEI, this is reflected in the opportunities offered to diverse workers for advancement. The promotion rate indicates how successful your organization is at career growth for all groups of employees.
Use this formula to measure the promotion rate:
Promotion Rate = Number of employees promoted / Total employees in the group
One percentage won't do the trick, so compare promotion rates by demographics. Study the trends within gender, ethnicity, and other factors.
For instance, if 50 women from your company are eligible for promotion, and 10 of them received promotions, the promotion rate would be:
Promotion Rate for Women = 10 / 50 = 0.2 or 20%
Even with positive efforts towards equal employee growth, a study by McKinsey affirms a continuing gap in promotions, where women continue to receive fewer promotions than their male counterparts. For women of color, the issue is further compounded, as their route to professional growth is much harder.

If you see discrepancies in promotion rates, it may be time to take a closer look at your HR metrics or your company's approach to DEI training. When you measure these metrics between different groups, you can identify the barriers and begin working to break them down.
Remember, a fair workplace inclusion strategy demands action, not just awareness.
5. Equal pay and pay equity
Equal pay for equal work is a key part of building an inclusive workplace. If pay differences exist based on gender, race, or other factors, it may indicate a need for change.
Let’s look at gender pay as an example. To understand pay gaps, you’ll need some basic employee information:
- A list of all employees
- Gender of each employee
- Breakdown of compensation (salary, bonuses, etc.)
- Weekly working hours for each employee
With that information, you can calculate the pay disparity. First, calculate the average hourly wage for both men and women in similar roles. For instance, if the average hourly pay for men is $50 and for women, it’s $42, the gender pay gap looks like this:
- Subtract the female hourly rate from the male hourly rate: $50 - $42 = $8
- Divide the difference by the male rate: $8 / $50 = 0.16
- Multiply the result by 100 to get the percentage gap: 0.16 x 100 = 16%
You can repeat this for other groups within your organization to gain further insights.
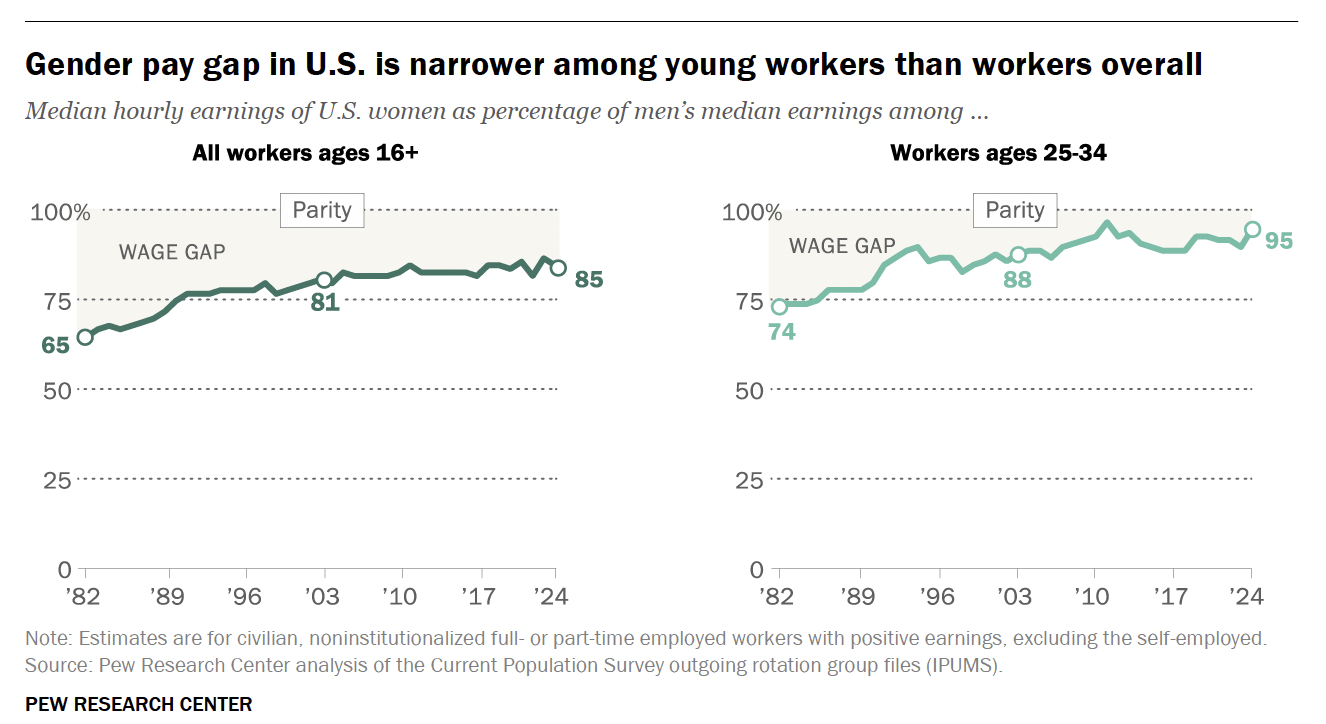
The gender pay gap in the U.S. has slowly narrowed over the past two decades. In 2024, women earned 85% of what men earned on average, according to a Pew Research Center report. The gap is even smaller for younger workers, where women ages 25 to 34 earn 95 cents for every dollar a man in the same group earns.
6. Employee resource group (ERG) participation
ERGs help employees with similar identities connect, support each other, and feel included. These groups receive organizational support, including funding, leadership access, and resources to thrive.
However, ERG participation rates may be lower than desired. Research from Traliant shows 24% of DEI leaders are "somewhat unconfident" that employees feel a sense of psychological safety and inclusion.

If you notice that participation in ERGs is lower than expected, you must assess why employees are hesitant to join.
Is there a lack of awareness, disconnect from the group's mission, or misalignment with employee needs? Are there practical barriers, such as time constraints or unclear benefits?
If you see such trends, look at your inclusion metrics and workplace diversity statistics. Understand how ERGs contribute to your overall DEI efforts and how to make them more accessible and relevant to employees. When you adjust these strategies, it leads to a higher engagement, a stronger sense of community, and ultimately, improved retention metrics.
7. Employee net promoter score (eNPS)
eNPS measures employee loyalty and engagement by asking one simple question: “On a scale of 0 to 10, how likely are you to recommend this company to a friend or colleague?”
Employees give a score from 0 to 10 based on their experience. If they score 9-10, they are called Promoters, 7-8 are Passives, and 0-6 are Detractors. To calculate the eNPS score, subtract the percentage of Detractors from the percentage of Promoters.
For example, if 80% of employees are Promoters and 15% are Detractors, the eNPS score would be +65. A high score means employees are happy and engaged, while a low or negative score shows there are areas that need improvement. To get a deeper understanding, break the score down by demographic groups.
If you measure eNPS through annual surveys, include open-ended questions. These can help uncover the reasons behind a low score within specific groups. This feedback is invaluable for improving equitable employee development and increasing overall engagement.
To make the most of this data, use a client and employee experience platform such as ClearlyRated, which helps you track employee satisfaction through customized surveys that reflect your team’s unique experiences.
You can also drive actionable insights with automated follow-ups and track changes in employee sentiment over time. This approach creates a strong foundation for employer branding and highlights your company's commitment to a positive workplace culture.
8. DEI initiative-focused metrics
These metrics help you see the real impact of your diversity efforts. If you start a leadership program for Black employees, you need to measure more than just how many people complete it. Look at real results, like:
- Increase in sales tied to the program
- Revenue per employee in the target group
- Promotion rates for underrepresented employees
- How many employees from diverse backgrounds hold higher-level roles
- Employee satisfaction and feedback (Net Promoter Score)
Also, track metrics like the number of ERG events, event participation, or diversity training attendance. Without measuring these key figures, it’s impossible to assess the success of your programs.
To align your metrics with the results you want to see, set these measurable goals early-on in the process.
9. Accessibility and workplace inclusion index
Accessibility and workplace inclusion go beyond providing physical accommodations. You must address potential barriers like technology, workplace layout, and social dynamics that could hinder the ability of employees to thrive.
Some employees, like neurodivergent people, may find office days hard. This can affect their work and comfort. Noticing these problems helps improve DEI efforts.
You can check workplace accessibility by asking an expert. They can suggest better layouts, designs, or changes to help employees with disabilities. For remote workers, adding captions on video calls can support those with hearing or thinking challenges.
To measure workplace inclusion:
- Use an inclusion index that checks fairness, safety, and growth chances.
- Look at survey answers on respect and job opportunities.
- Compare scores across groups to find problems and track progress on your DEI initiatives.
10. Recruitment diversity metrics
Tracking recruitment diversity metrics allows you to evaluate the efficiency of your hiring practices. To begin, evaluate the diversity in your employment pipeline, from sourcing to hiring. Monitor the representation of underrepresented groups at each stage.
Then, look at the number of applicants from diverse backgrounds compared to your total applicant pool. Pay attention to how many candidates progress through interviews and receive job offers. Identify which recruitment channels bring in the most diverse talent, whether through job boards, recruitment events, or referrals.
To better visualize this data, use a diversity dashboard. It helps highlight trends and gaps. Also, track diversity hiring and turnover rates for specific demographic groups. If certain groups drop off at specific stages, it could indicate biases or barriers in your hiring process. Addressing these areas will help you ensure a more equitable recruitment experience.
11. Inclusion survey results
Inclusion surveys enable you to understand if employees feel valued, respected, and treated fairly at work. They also show if your DEI training and inclusion strategy is making a difference.
When you’re designing these employee engagement surveys, ask clear and specific questions. Instead of a broad question like “Do you feel appreciated at work?” try, “How often is your work recognized?” or “Do you feel included in company culture?” This gives better insights.
Once the survey is complete, look for trends. Check both high and low scores and see where employees left detailed feedback. If the survey isn't anonymous, compare results by gender, race, role, or location. For instance, if a specific department scores poorly on leadership support, that’s where you should focus your efforts.
Compare past engagement scores to track progress, highlight disparities, and identify groups that may feel excluded. Tracking responses over time helps you evaluate whether your DEI initiatives are achieving the desired impact.
12. Diversity in leadership metrics
To understand diversity in leadership, check how many people from different backgrounds hold senior, middle, and entry-level management roles. Then, see how often they get promoted.
Are some groups struggling to move up? Look at career growth patterns to find any delays or barriers. Compare promotion rates between diverse employees and others to spot differences.
Use HR metrics to find gaps. Some key numbers to track include:
- Employee turnover rate
- Internal mobility rate
- Diversity ratio
- Employee engagement score
If you notice disparities, adjust your recruitment and development strategies. Regularly tracking leadership diversity helps you pinpoint areas for improvement, shaping a more inclusive leadership pipeline. It also contributes to improving your overall human capital analytics and driving systemic change.
13. Community engagement metrics
These metrics track volunteer participation, donations, and outreach efforts. You’ll want to measure the number of partnerships with local organizations and how involved employees are in community initiatives.
Look at the frequency of these interactions and assess the impact of your outreach programs. Are people engaged or just passively involved?
Tracking these figures also helps you evaluate the success of corporate social responsibility (CSR) programs. Measure these empowerment metrics regularly to see where you can strengthen community ties. Finally, use this data to shape decisions that balance profit with social responsibility.
14. Training & development participation
To measure employee development, look at their participation in training. Monitor the rates of participation in different programs throughout the company. Observe what kind of training employees choose, from leadership training to technical skills.
Then, evaluate completion rates to see the level of dedication employees have toward improving their skills. Note whether employees exhibit improved performance or progress following training.
If there is low turnout, determine why. Is the program applicable? Is it accessible? Apply these learnings to your training programs and implement opportunities that foster growth in all employees.
15. Feedback and exit interview data
When an employee leaves a company, it can be for many reasons. Maybe they’re dissatisfied with the leadership, their growth is limited, or they find the culture unfit.
Although 42% of voluntary turnover can be avoided, some will inevitably leave. In these situations, you can still offer a positive exit experience. This builds your organization's reputation and creates an alumni network of past employees who can aid in future hiring.
A Gallup poll of 150 Fortune 500 CHROs discovered that only 10% of companies manage employee exits well. Use this information to act proactively, modify policies, and establish a culture that resolves employee issues before exit.
16. Psychological safety index
Psychological safety and inclusion go hand in hand and usually take shared efforts to create a healthy, productive work environment. To quantify psychological safety, measure how safe employees feel expressing ideas, raising questions, or making errors without fear of being criticized or retaliated against. This sense of safety fosters creativity, teamwork, and accountability.
Use survey data to monitor employees' perceptions of their work environment and whether they trust their peers and leaders. Find out where psychological safety is missing, specifically in leadership behavior or team dynamics. Closing those gaps creates a culture of transparency and innovation that is essential for long-term success.
17. Benefits usage by demographics
When you’re evaluating benefits, you need to track how different groups within your organization engage with them. For example, analyze which benefits are most utilized by employees of varying ages, job roles, or locations.
Are younger employees opting for mental health support, while older employees focus more on retirement planning?
This data gives you insight into whether your benefits package meets the diverse needs of your workforce. If certain groups aren't tapping into available benefits, it could point to gaps in communication or accessibility. With this insight, you can adjust your benefits package and make it more relevant to everyone in your organization.
Best practices for implementing DEI metrics
To effectively implement DEI metrics, start with a clear process that fits your company’s needs. Follow these five steps for a practical approach:
Step 1: Determine your DEI goals
Start by clearly defining the specific DEI outcomes you want to achieve. These goals should align with your company’s strategic priorities and be measurable within a specified timeframe. Some of these DEI goals might include increasing the representation of women or underrepresented minorities in leadership roles, reducing unconscious bias in hiring, or improving pay equity.
To get a sense of what employees expect, you can conduct organizational culture surveys or pulse surveys. These surveys help understand employees’ thoughts on DEI topics and reveal areas where improvements are necessary.
Additionally, share these goals with both your employees and shareholders to ensure commitment across all levels of the organization.
Step 2: Choose the right data collection method
Second, determine which DEI measures are most applicable to your goals. These metrics will inform the way you capture data on your DEI initiatives.
Select data collection methods that combine both qualitative and quantitative insights. While numbers give you hard data, qualitative feedback provides crucial context to guide your interpretation of these figures.
You can use methods like:
- Employee feedback surveys
- HR data and analytics
- Focus groups
- One-on-one meetings
- External benchmarking
Step 3: Collect the data
Now, use your data collection methods to collect ongoing feedback about your DEI initiatives. As you implement new DEI programs, policies, or resources, send out employee surveys. In addition, hold focus groups, create a suggestion box, or organize regular team meetings to gather insights.
Aim to collect feedback consistently to ensure continuous improvement. Ideally, check in with employees quarterly or annually for reliable, actionable data.
Step 4: Review insights
Once you’ve collected your data, dive into the analysis phase. Start by segmenting the data based on relevant demographic factors like race, gender, sexual orientation, and job function. This segmentation allows you to identify disparities and ensure that you are addressing the right areas.
Look for patterns that reveal areas of improvement. For instance, you might notice a lack of diversity in certain departments or that women employees are leaving at higher rates than their male counterparts.
You can also benchmark your data against external metrics, such as industry standards or competitor data, to assess whether your company is lagging behind in certain DEI areas.
Step 5: Take action
The last step in the DEI process is to take action and improve your policies. Use DEI metrics to improve hiring, support employee growth, and make your workplace more inclusive. You can also use software tools to track and analyze DEI data.
HR platforms have tools to help you see trends, check data by factors like gender or race, and create reports for leadership. These tools make it easier to track progress over time.
Once action steps are implemented, continue to track the impact of your DEI initiatives. Collect data on employee engagement, retention rates, and hiring diversity to measure the effectiveness of changes. Set periodic reviews (quarterly or bi-annually) to track progress, identify new challenges, and ensure your DEI strategy evolves with your organizational needs.
Product and tool recommendations
When it comes to DEI surveys, choosing the right tools is essential for monitoring progress and developing effective strategies. ClearlyRated is an extremely effective customer experience (CX) platform for collecting employee feedback and tracking DEI initiatives.
The tool employs NPS surveys to measure the satisfaction of your teams, enabling businesses to evaluate their work environment. This information enables organizations to understand the views and satisfaction of employees, providing real, tangible feedback on your DEI initiatives.
ClearlyRated also offers NPS benchmarks, letting you compare your DEI progress with industry standards. This helps set realistic goals. With its real-time feedback and strong analytics, you can quickly respond to insights and make improvements. These insights help you improve employee satisfaction and retention.
The survey team also provides a Satisfaction Survey Checklist to help you collect valuable DEI data without common survey problems. The platform connects easily with CRM systems like Salesforce, Bullhorn, and Erecruit. These integrations make it simple to add employee feedback to your workflows, so you don’t have to enter data manually and can act on insights faster.
Driving effective change with DEI metrics
If you don’t monitor and assess the impact of your DEI initiatives, they can become ineffective. Tracking DEI metrics over time keeps your organization accountable, offering clear insights into where you started, what’s been successful, and where improvements are still needed.
While tracking these DEI metrics help you understand the current state of DEI within your organization, it’s even more crucial to turn this data into actionable insights that drive real change.
With ClearlyRated, you can seamlessly gather employee feedback, track DEI progress, and benchmark your initiatives against industry standards. The platform allows you to collect real-time insights, track changes over time, and assess team satisfaction through NPS surveys.
Get started with ClearlyRated today and empower your team with the tools needed for a stronger, more inclusive workplace.
Heading
Heading 1
Heading 2
Heading 3
Heading 4
Heading 5
Heading 6
Lorem ipsum dolor sit amet, consectetur adipiscing elit, sed do eiusmod tempor incididunt ut labore et dolore magna aliqua. Ut enim ad minim veniam, quis nostrud exercitation ullamco laboris nisi ut aliquip ex ea commodo consequat. Duis aute irure dolor in reprehenderit in voluptate velit esse cillum dolore eu fugiat nulla pariatur.
Block quote
Ordered list
- Item 1
- Item 2
- Item 3
Unordered list
- Item A
- Item B
- Item C
Bold text
Emphasis
Superscript
Subscript
Blogs that elevate your efforts

.png)


NPS 101 for Legal Firms

How to Empower Women in the Workplace

NPS Benefits: 11 Benefits of the Net Promoter Score


%20and%20how%20can%20you%20increase%20it.png)
_%20A%20Step-by-Step%20Guide.png)


Top 11 Medallia Alternatives & Competitors in 2025


B2B Firms Must Prioritize CX Management—Are You Ready?


The State of DEI in the Accounting Industry


